Steel Price Spreads
In the steel industry, pricing differentials between raw materials or intermediate semi-finished steels and finished steel products play a crucial role in determining profitability and investment potential. Whether you are a producer managing input costs, a trader analysing market trends or an investor evaluating modernisation opportunities, monitoring these price spreads can provide essential insights. Margins between iron ore, scrap and finished steel products such as hot-rolled coil or rebar can fluctuate very markedly due to changes in supply chains, demand cycles and global economic factors.
By keeping track of steel price spreads, businesses can better anticipate market shifts, identify arbitrage opportunities and make better-informed strategic decisions. At SteelOnTheNet, we provide historic data on these price spreads, helping industry professionals navigate this complex landscape with confidence. Explore our latest price differential trends below.
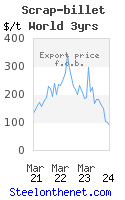
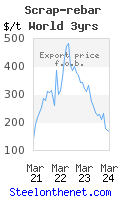
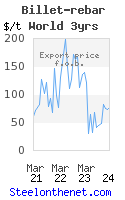
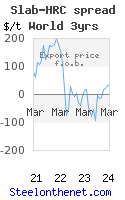
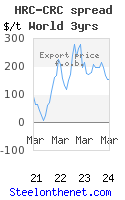
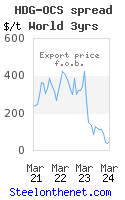
The charts above [updated monthly] may be helpful to investors considering investment in billet mills, in rebar production or in flat product production as they provide some indication of historic pricing differentials (i.e. steelmaker margins) in the long and flat product value chains.
All steel price spreads are in US$/t fob local port; based on average world export prices. Note that latest data points will generally change one month later, when they will be based on a more complete set of transaction data. Source of pricing information is Metals Consulting International Limited [MCI].
For further price spread history for long or flat products or to purchase MCI's data for steel pricing differentials going back ~15 years, please email us.