Historic Steel Price Graphs
Historic steel price data is a vital tool for industry professionals, financial analysts and decision-makers across the metals and manufacturing sectors. These price charts provide crucial insights into market trends, helping businesses make informed decisions about purchasing, inventory management and long-term investment strategies. By tracking the price movements of key steel products like scrap, billets and slabs – and finished steel products – stakeholders can better understand market cycles, identify pricing patterns and anticipate potential shifts in the industry.
For manufacturers, traders and buyers, these historical price trends serve as essential benchmarks for contract negotiations and risk management. The data is particularly valuable for industries heavily dependent on steel inputs, such as construction, automotive and appliance manufacturing, where material costs can significantly impact project profitability. Additionally, investors and analysts use this historical pricing information to assess market conditions, evaluate investment opportunities in steel-related companies and develop more accurate forecasting models for the global steel industry.
Historic Price Charts: Scrap, Billet, Slab & More
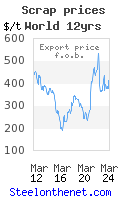
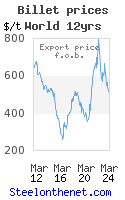
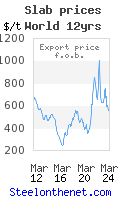
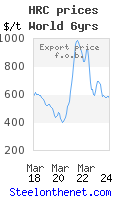

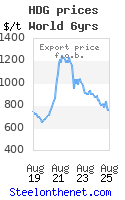
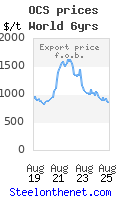

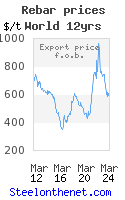
Number of historic steel price charts: 9
All steel prices and raw material price data are in US$ [dollars] per tonne fob local port; monthly world price average.
Note that latest data point(s) on the graphs may change, as more transaction price data becomes available.
All pricing information is compiled by Metals Consulting International Limited [MCI].