World Steel Demand 2025
Understanding steel consumption trends is crucial for industry professionals, but finding detailed demand segmentation by product or sector can be challenging. Many sources provide broad figures, yet few offer the in-depth insights needed to analyse specific market segments. SteelOnTheNet bridges this gap by providing expert analysis and data on steel demand across various regions and countries. Whether you need a comprehensive view of a national market or a deeper understanding of product- or sector-specific trends, our resources can help you navigate the complexities of global steel consumption.
Consumption Analysis by Region, 2025
| Region | Demand (Mt) |
|---|---|
| EU | 135 |
| Other Europe | 56 |
| CIS | 54 |
| North America | 134 |
| South America | 45 |
| Middle East & Africa | 107 |
| Asia & Oceania | 1,187 |
| World | 1,718 |
Source: worldsteel (World Steel in Figures 2026) and Metals Consulting International. Data as of 2025.
Determinations above are finished steel product demand estimates for 2025 in million tonnes (Mt), from worldsteel data and Metals Consulting International (MCI) calculations. See our methodology page to learn more about steel demand calculations.
Use by Product Shape, 2025
| Steel Shape | Demand (Mt) |
|---|---|
| Flat products | 720 |
| Long products | 837 |
| Tube products | 161 |
| World | 1,718 |
Source: MCI research, from the product assessment of James F King. Data as of 2025.
Calculations are indicative finished steel demand assessments for 2025. Tube data includes welded and seamless tube. For chart, see below. For the split by individual product, with production and trade, see world steel demand by product 2025.
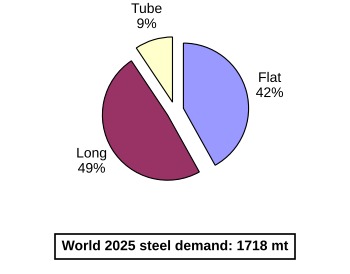
Demand estimates by shape indicate estimated global steel use analysed by flat products (including plate, hot-rolled coil and sheet, cold-rolled and coated sheet such as hot-dip galvanised (HDG) sheet and tinplate), long products (including rail, heavy and medium sections, merchant bar, rebar and wire rod) and tube (welded pipe and seamless tube). Demand analysis figures prepared by James F King for 2025.
Use by Application, 2025
World steel demand in 2025 is divided between nine end-use sectors, led by construction, mechanical engineering and metal products, in our steel end-use analysis 2025. That page gives the tonnage and share for each sector, with the key assumptions, sources and cross-checks behind each figure, and offers the full workbook for download.
Product demand analyses for individual countries and regions, with historic data and demand projections, can be prepared on request. Please contact MCI. All 2025 product demand figures have been compiled by MCI.
Analysis by Consuming End-Use Industry, 2025
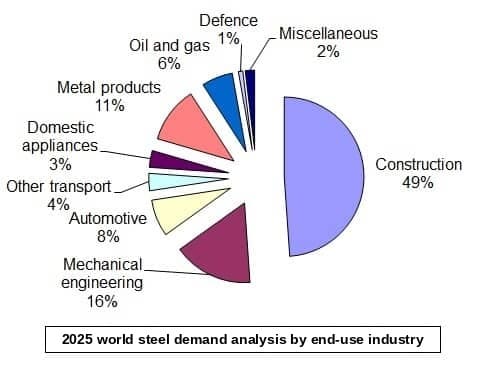
Demand estimates by sector are indicative of global 2025 steel demand. Construction includes structural and building work. Mechanical engineering includes machinery and equipment and components, as well as heating, ventilating and air conditioning (HVAC) markets. See how each sector is sized in our end-use sector assumptions.
Automotive sector includes passenger vehicles and light commercial vehicles (see automotive assumptions). Other transport includes shipbuilding (covering container ships, dry cargo ships, LPG carriers, tankers, passenger ferries) as well as rail, buses and heavy vehicles. Metal products include furniture, fasteners, wire products, containers, drums and boxes.
Defence estimates are based on MCI assumptions concerning steel demand for warships, submarines, tanks, armoured vehicles, artillery, aircraft and artillery ammunition, as well as military buildings. Figures are MCI estimates of steel end use by application for year 2025 total steel consumption.
For a more comprehensive analysis of steel demand applications, see a 2022 research article on global iron and steel mass flow published by LD Danny Harvey.
Requirement by Quality, 2025
| Steel Quality | Demand (Mt) |
|---|---|
| Carbon steel | 1,619 |
| Engineering steel | 46 |
| Stainless steel | 51 |
| Tool steel | 2 |
| World | 1,718 |
Figures are approximate. Source: MCI research. Data as of 2025.
Data above are from MCI analysis of steel use by grade for 2025. Engineering steels are often also referred to as special bar quality (SBQ) steels; these are steels that typically move or rotate while in use. Global melt shop production of stainless steel in 2025 was about 64 Mt, according to worldstainless.
Historic Consumption
| Year | Apparent Steel Use (Mt) |
|---|---|
| 2025 | 1,718 |
| 2024 | 1,751 |
| 2023 | 1,779 |
| 2022 | 1,777 |
| 2021 | 1,841 |
Source: worldsteel, World Steel in Figures 2026. Data as of 2025.
Apparent steel use is finished steel products, in millions of tonnes, as published by the World Steel Association (worldsteel) in World Steel in Figures 2026. For demand forecasts for 2026 and 2027, see our steel market outlook.
Custom Steel Demand Analysis Reports
Steel consumption analysis reports can be customised for any country or region, providing detailed breakdowns by:
- Flat products: plate, hot-rolled coil (HRC), cold-rolled coil (CRC), galvanised sheet and tinplate
- Long products: rail, sections (including beams), reinforcing bar (rebar), other bar and wire rod
- Tubular products: seamless tube and welded tube
Each such spreadsheet report includes historic consumption patterns and projected demand figures. Our analyses combine production estimates with customs-sourced trade data to deliver segmentation detail for your specific market of interest. Each analysis of apparent steel consumption also has estimates of demand by end-use sector.
Tell us which country or region you need, and we will set out what a steel demand analysis would cover.

Need This Analysis for Your Own Plant or Market?
152 projects in 48 countries since 2001
Free, confidential first conversation No obligation Reply within one working day