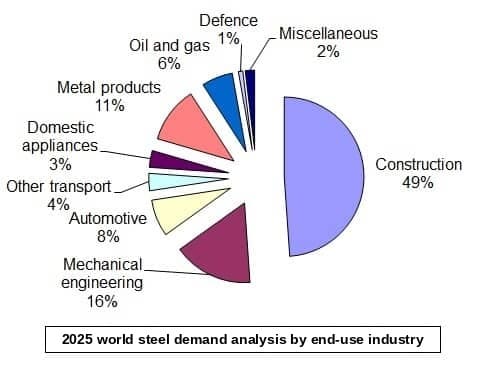
Each card shows the sector total, what it includes, the main assumptions and how the figure compares with independent evidence.
Construction
842 Mt 49.0% of world demand
Structural and building work, including infrastructure such as roads, bridges and rail structures, sheet piling and structural tube.
Key Assumptions
- Takes most of the rebar (about 98%), heavy sections (about 85%), galvanised and coated sheet (about 88%) and light sections and bar (about 76%) not used elsewhere.
- Also takes about 44% of remaining plate and hot-rolled coil and about half of remaining wire rod (mesh).
- Sheet piling 6 Mt, in line with 2025 market reports.
Cross-check: adding up national data gives about 840 Mt: China 49% of its demand, India 59%, EU 37% and the US about 42%. Consistent
Sources: CISA / China Daily; EUROFER; USGS; Indian industry data; MCI 2026 industry discussions / best estimates.
Mechanical Engineering
279 Mt 16.2% of world demand
Machinery, plant, equipment and components, electrical engineering, and heating, ventilating and air conditioning (HVAC).
Key Assumptions
- Takes about 36% of remaining plate and hot-rolled coil, 55% of remaining cold-rolled coil, 19% of light sections and bar, and 30% of wire rod.
- HVAC ducting about 10 Mt: US$215bn market × 25% materials × 15% ducting, at US$800 per tonne.
- Includes process and machinery tube.
Cross-check: China's machinery sector alone uses about 180 Mt; national data add up to about 275 Mt. Consistent
Sources: China Metallurgical News; MPI; EUROFER; Arizton; MCI 2026 industry discussions / best estimates.
Automotive
128 Mt 7.5% of world demand
Passenger cars and light commercial vehicles, including spare parts.
Key Assumptions
- 2025 production of 71.3 million cars and 20.9 million light commercial vehicles (OICA).
- About 900 kg of steel per car (see steel in automotive) and 1,025 kg per light commercial vehicle.
- Plus 30% for press-shop yield loss and 15% for spare parts.
- About 76% flat products, mainly coated sheet.
Cross-check: China's automotive steel use is put at 48–65 Mt; the same method gives about 50 Mt for China's 34.5 million vehicles. Consistent
Sources: OICA; SteelOnTheNet; CISA; IDOM; MCI 2026 industry discussions / best estimates.
Other Transport
60 Mt 3.5% of world demand
Shipbuilding, rail track and rolling stock, heavy trucks, buses and coaches, and aircraft.
Key Assumptions
- Ships about 25 Mt: 95.7 million deadweight tonnes (dwt) delivered in 2025 (China's 53.7 million dwt was 56.1% of the world total) × 0.20 t steel per dwt, plus 30% for yield loss and repairs.
- Heavy trucks about 16 Mt: 3.9 million units × 3.25 t, plus 25%. Buses about 3 Mt: 320,000 units × 8.1 t, plus 25%.
- Rail track about 12 Mt, plus rolling stock. Aircraft about 0.1 Mt.
Cross-check: China's shipbuilding steel use of 16.5–17.8 Mt implies about 25–30 Mt for world shipbuilding; the sector range is about 58–75 Mt. Consistent (lower end)
Sources: CANSI; Clarksons Research; OICA; MCI 2026 industry discussions / best estimates.
Domestic Appliances
59 Mt 3.4% of world demand
White goods production: refrigerators, washing machines, cookers, air conditioners and similar.
Key Assumptions
- 570 million major appliances made in 2025.
- Average weight 124 kg, of which 65% steel, plus 28% for parts and yield loss.
- About 82% flat products, mostly coated and cold-rolled sheet.
Cross-check: forecasts put China's appliance steel use at 19–29 Mt, with China making 50–60% of the world's white goods. That implies 32–57 Mt for the world. Upper end
Sources: major appliances market report; MPI; Mysteel; MCI 2026 industry discussions / best estimates.
196 Mt 11.4% of world demand
Wire products, fasteners, freight containers, drums, boxes and tins, furniture tube and general fabrication.
Key Assumptions
- Wire products 38.5 Mt: 35 Mt of wire consumption plus 10% for yield loss.
- Fasteners about 31 Mt: China makes 9.78 Mt, about 35% of world output.
- Freight containers about 14 Mt: 6.8 million twenty-foot equivalent units (TEU) × 1.75 t steel per TEU, plus 20%.
- All tinplate goes to packaging; a share of plate and hot-rolled coil goes to drums and boxes.
Cross-check: about half of the total can be traced bottom-up; the rest is general fabrication with no independent total. Partly verified
Sources: IndexBox; China fastener industry data; China Container Industry Association; MCI 2026 industry discussions / best estimates.
Oil and Gas
108 Mt 6.3% of world demand
Exploration and transport: oil country tubular goods (OCTG: casing, tubing and drill pipe), linepipe, large-diameter pipe, and rig construction.
Key Assumptions
- Takes most of the tube not used in vehicles, ships, appliances and defence equipment.
- Includes large-diameter and welded pipe for oil and gas transmission and gathering.
- Rig construction about 0.4 Mt (about 50 rigs × 7,200 t).
Cross-check: the total depends on definition. OCTG and linepipe alone come to about 35–55 Mt; the rest is welded pipe that could also count as water, distribution or process pipe. Definition-sensitive
Sources: OCTG and linepipe market reports; CRU; Freedonia; MCI 2026 industry discussions / best estimates.
Defence
13 Mt 0.8% of world demand
Military equipment (warships and submarines, tanks, armoured vehicles, artillery, rocket launchers, aircraft), artillery ammunition and building reinforcement for military facilities.
Key Assumptions
Defence Equipment and Ammunition, 2025
| Equipment | Basis | Steel (kt) |
|---|
| Main battle tanks | 62,748 units (active and stored) ÷ 25-year life × 55 t | 166 |
|---|
| Armoured vehicles | 400,000 IFVs, APCs and light armoured vehicles ÷ 25 years × 10 t | 192 |
|---|
| Self-propelled artillery | 20,964 units ÷ 25 years × 30 t | 30 |
|---|
| Towed artillery | 36,832 units ÷ 25 years × 5 t | 9 |
|---|
| Rocket launchers | 22,000 units ÷ 25 years × 10 t | 11 |
|---|
| Military aircraft | 52,000 aircraft ÷ 25 years × 1.5 t | 4 |
|---|
| Naval shipbuilding | 735,000 t displacement a year × 45% steel | 397 |
|---|
| Artillery ammunition | 8.5 million shells a year × 36 kg | 413 |
|---|
| Total | Including 20% yield loss (35% for shells) | 1,221 |
|---|
Figures are approximate. Source: MCI research. Data as of 2025.
- Naval shipbuilding covers submarines, aircraft carriers, destroyers, frigates, corvettes and amphibious ships. It is sized from warship tonnage delivered worldwide (about 1.47 Mt of displacement in 2024–25, Euronaval) rather than counted class by class.
- Ammunition: Russia about 4.5 million shells, Europe about 1.5 million, US about 500,000 and other producers about 2 million a year. A 155 mm shell holds about 36 kg of forged steel.
- Building reinforcement for military facilities about 11 Mt.
- Line-by-line detail, sources and product splits are on the Defence detail sheet of the downloadable workbook.
Cross-check: equipment and ammunition (about 1.2 Mt) are built up line by line; less than 1% of Europe's heavy plate goes to defence. Building reinforcement has no independent benchmark. Low confidence
Sources: GlobalMilitary.net; Global Firepower; Euronaval; General Dynamics OTS; European Commission; Kallanish; MCI 2026 industry discussions / best estimates.
Other Industries / Miscellaneous
33 Mt 1.9% of world demand
Uses not covered elsewhere, such as agriculture, greenhouses, signage and small-volume applications.
Key Assumptions
- A small share (about 1–6%) of each remaining product.
- Also absorbs rounding in the allocation.
Cross-check: no independent benchmark. Not benchmarked
Source: MCI 2026 industry discussions / best estimates.
Definitions differ between publishers. worldsteel, for example, reports a wider "buildings and infrastructure" category of about 52% and includes trucks within automotive, so its sector shares are not directly comparable with those above.